📊 Visualizing Events on the Dashboard
Sometimes it can be really usefull to see when specific events were fired, especially when filtering for them.
That’s why you’re now able to visualize events on the dashboard chart.
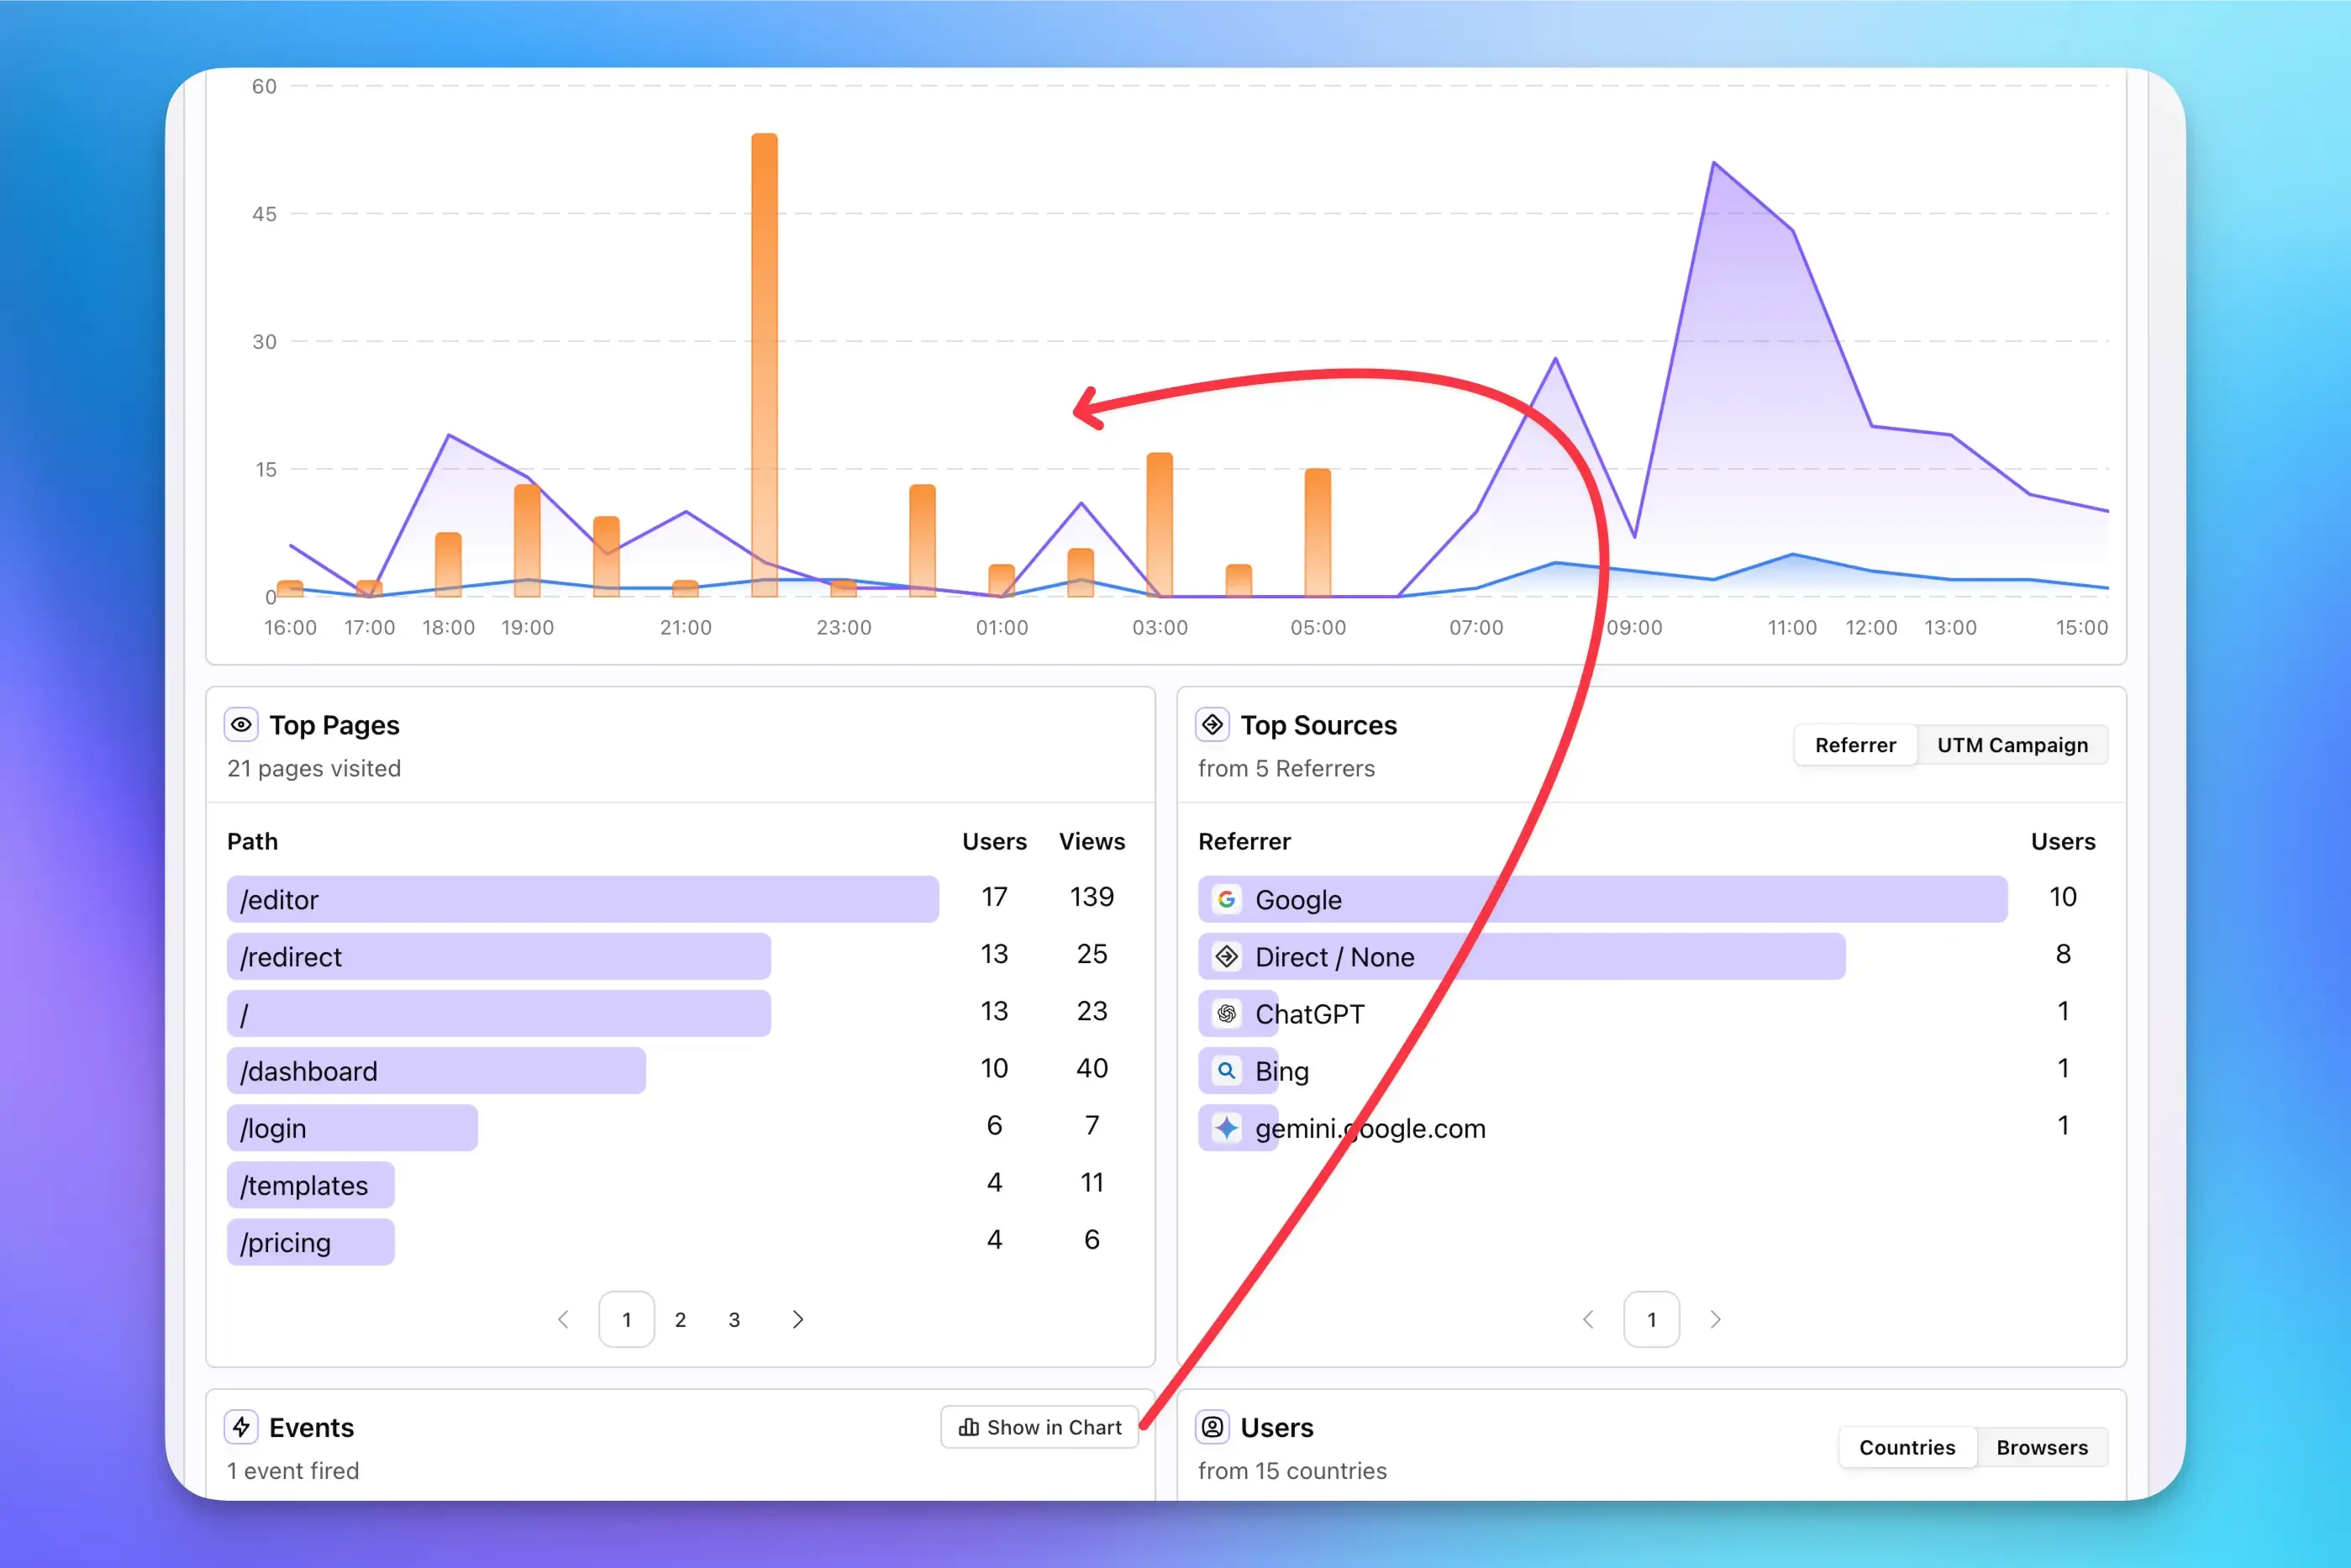
You can do it by clicking on the “Show in Chart” button in the events card, or it will automatically show up if you’re filtering for events.